
Silver as Investment vs Industrial Commodity: Dual Demand Analysis
Explore silver's unique dual nature—50% industrial demand (electronics, solar) and 30% investment demand (coins, bars). Understand price drivers, volatility, and strategic allocation in 2025.
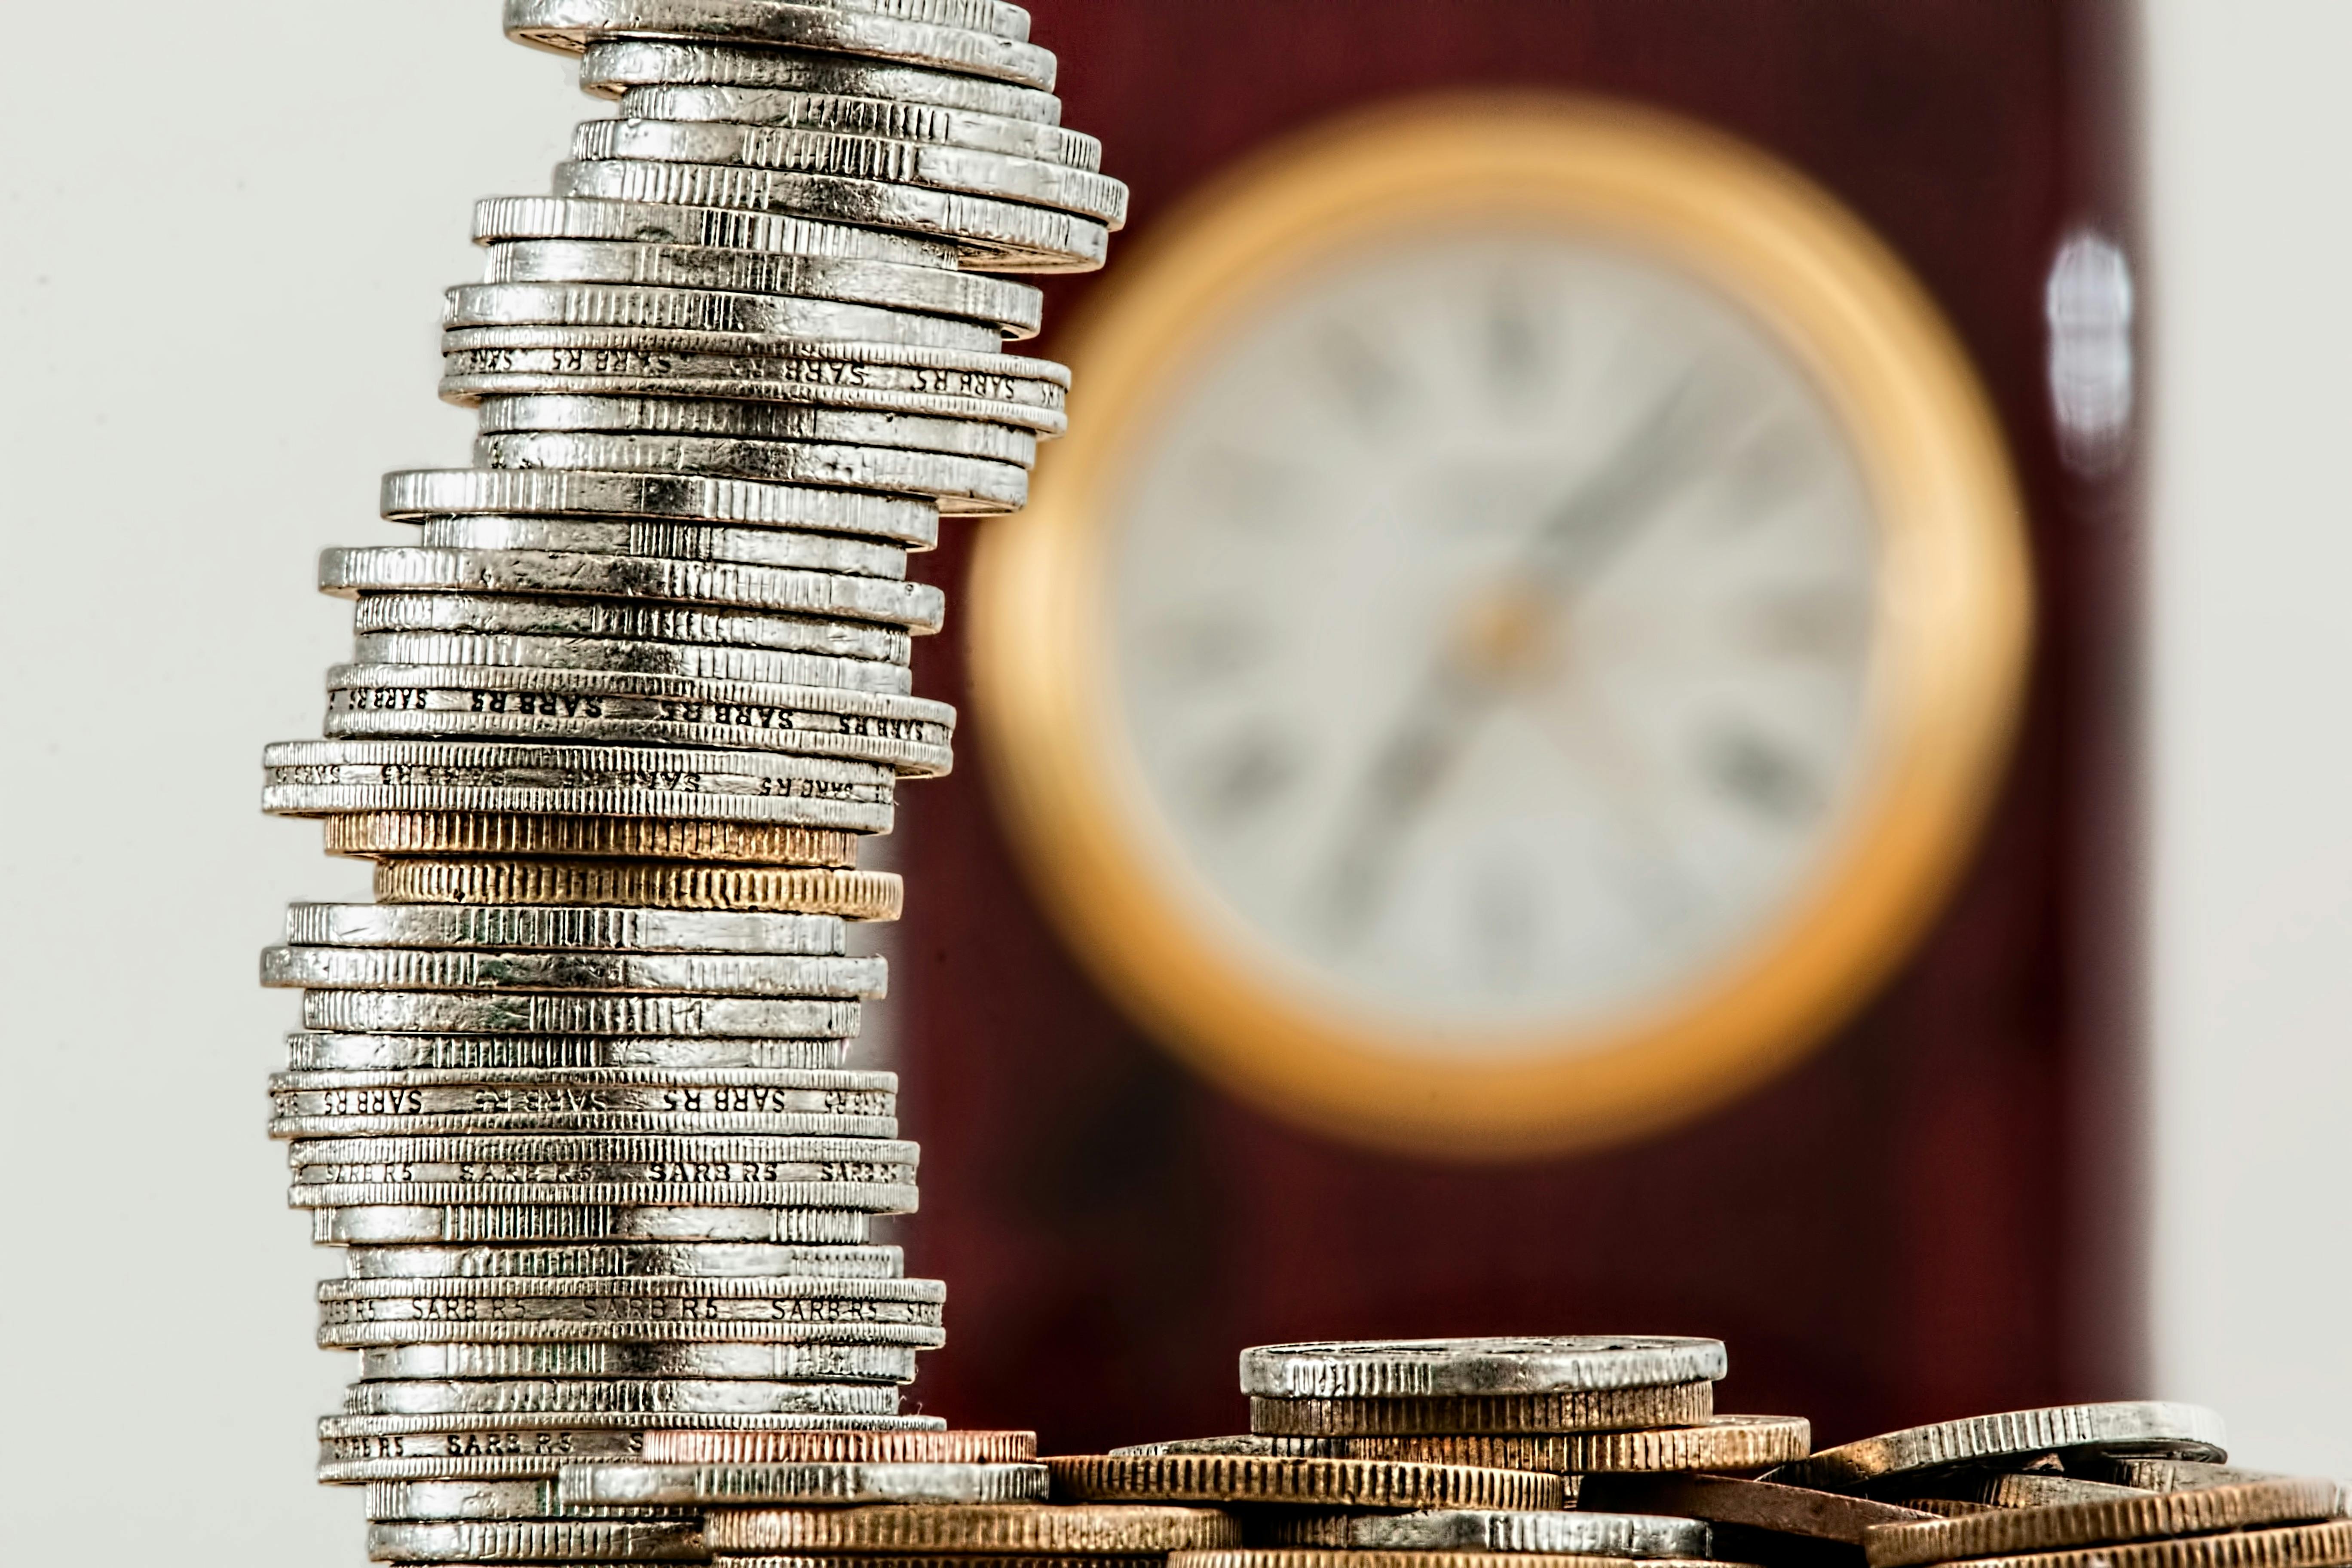
Silver occupies a unique position in commodity markets as the only major metal with substantial dual demand—roughly half driven by industrial applications (electronics, solar panels, medicine) and half by investment and monetary purposes (coins, bars, jewelry, ETFs). This bifurcated demand profile creates pricing dynamics fundamentally different from pure industrial metals like copper or pure monetary metals like gold. With annual production around 1 billion ounces worth $25+ billion, silver's market exhibits extreme volatility—often moving 2-3x more than gold—as investment and industrial demand drivers pull in different, sometimes conflicting, directions.
Understanding silver's dual nature is critical for investors in 2025 as powerful crosscurrents shape the market: surging industrial demand from solar energy expansion and electrification competes with investment demand tied to inflation fears, monetary policy, and gold correlation. This comprehensive analysis examines silver as investment asset versus industrial commodity, exploring demand drivers, price dynamics, supply constraints, and strategic implications for investors navigating silver's complex, volatile landscape.
Silver Dual Demand at a Glance (2025)
Industrial Demand
~50% of Total
Electronics, solar, medical
Investment Demand
~30% of Total
Coins, bars, ETFs
Gold:Silver Ratio
~75-85:1
Historical average ~60:1
Understanding Silver's Dual Demand Structure
Silver's approximately 1 billion ounce annual demand breaks down across competing categories:
Industrial Demand (~500 Million Ounces, ~50%)
- Electronics and Electrical (~250M oz, 25%): Silver's unmatched electrical conductivity makes it essential in electronics—every smartphone, computer, and electronic device contains silver in circuit boards, contacts, and switches. Industrial demand is price-inelastic short-term (manufacturers can't easily substitute) but elastic long-term (higher prices drive R&D for alternatives).
- Photovoltaics (Solar Panels) (~130M oz, 13%): Fastest-growing demand segment. Each solar panel uses ~20 grams of silver paste for conductivity. As solar capacity expands 15-20% annually, silver demand from this sector surges—projected to reach 200M+ oz by 2030.
- Medical and Antibacterial (~50M oz, 5%): Silver's antibacterial properties drive use in wound dressings, medical devices, water purification, and fabrics. Steady, non-cyclical demand.
- Other Industrial (~70M oz, 7%): Mirrors, catalysts, brazing alloys, bearings. Diverse applications across industries.
Investment Demand (~300 Million Ounces, ~30%)
- Physical Bullion (Coins and Bars) (~200M oz, 20%): Retail and institutional investors buy silver coins (American Eagles, Maple Leafs, Philharmonics) and bars as store of value, inflation hedge, and portfolio diversification. Demand is highly cyclical—spiking during financial stress and inflation fears, collapsing during bull markets in stocks.
- ETFs and Similar Products (~50-100M oz net flows, varies): Silver ETFs (SLV, SIVR, PSLV) saw massive inflows 2020-2021 (+300M oz) but reversed 2022-2024 as rates rose. Investment demand is volatile and sentiment-driven.
Jewelry and Silverware (~200 Million Ounces, ~20%)
Jewelry blends investment and industrial characteristics. In Western markets, silverware is decorative (industrial-like). In Asia (India, China), jewelry often serves as wearable wealth (investment-like), with demand responding to prices and economic conditions.
Supply: Mining and Recycling (~1 Billion Ounces)
- Mine Production (~820M oz, 82%): Primary silver mines produce ~30%; remaining 70% is byproduct from copper, lead, zinc, and gold mining. This matters enormously—silver supply doesn't respond directly to silver prices if most comes from base metal operations driven by copper/zinc/lead economics.
- Recycling (~180M oz, 18%): Industrial scrap, old jewelry, and photographic waste (declining) provide secondary supply. Recycling is price-elastic—higher silver prices increase recycling rates.
Investment Demand Drivers: Silver as Monetary Metal
Historical Monetary Role
Silver served as money for thousands of years—the word "silver" and "money" are the same in many languages (French: argent, Spanish: plata). Until 1965, US dimes, quarters, and half-dollars were 90% silver. Silver's monetary heritage creates persistent investment demand from those viewing it as "poor man's gold"—an accessible precious metal for wealth preservation.
Investment Demand Characteristics
Pro-Cyclical to Economic Uncertainty:
- Inflation Fears: Silver investment demand surges when inflation expectations rise. 2020-2021 saw coin demand spike as governments printed trillions and inflation fears escalated.
- Currency Debasement Concerns: Negative real interest rates (nominal rates below inflation) make non-yielding assets like silver relatively attractive. When 10-year Treasury yields 3% but inflation is 5%, silver looks better despite generating no income.
- Financial System Distrust: Banking crises, bail-ins, or systemic stress drive flight to physical assets outside the financial system. March 2020 and October 2008 both saw silver coin demand overwhelm supply.
Gold Correlation and Gold-Silver Ratio:
Silver prices correlate ~0.7-0.8 with gold (very high) because both are precious metals and stores of value. However, silver exhibits higher beta—typically moving 2-3x gold's percentage swings. If gold rallies 10%, silver often rallies 20-30%. Conversely, if gold drops 10%, silver may drop 20-30%. This amplification attracts speculators but creates extreme volatility for investors.
The gold-silver ratio (gold price ÷ silver price) historically averages ~60:1. In 2025, it hovers ~75-85:1, meaning silver is relatively cheap versus gold. When this ratio is high (>80:1), some investors view silver as undervalued and buy expecting ratio reversion. Conversely, when ratio is low (<50:1), silver may be overvalued relative to gold.
Speculative Demand and Momentum:
Silver's small market size (~$30B vs. $15T for gold) makes it susceptible to speculation and manipulation accusations. Retail traders piling into silver (WallStreetBets' #SilverSqueeze in 2021) can move prices 10-20% in days. This speculative element adds volatility beyond fundamentals.
Industrial Demand Drivers: Silver as Technology Metal
Electronics and Electrification
Silver's electrical conductivity (highest of all metals) makes it irreplaceable in many applications. Every car produced contains 15-30 grams of silver in electrical systems; electric vehicles use 25-50 grams (higher due to more complex electronics and battery management systems). As global EV production scales from 10 million units (2023) to projected 30-40 million (2030), silver demand from automotive increases significantly.
Consumer electronics—smartphones, laptops, tablets, appliances—represent steady baseline demand (~250M oz annually) that grows modestly with global GDP and device proliferation.
Solar Photovoltaic Explosion
Solar panel manufacturing is silver's fastest-growing demand sector and potentially most consequential. Each gigawatt (GW) of solar capacity requires ~12-15 tonnes of silver (400,000-500,000 oz). Global solar installations are projected to grow from ~350 GW (2023) to 600+ GW annually by 2030—potentially consuming 200-250M oz of silver by decade's end, up from ~130M oz currently.
This demand is price-inelastic short-term (solar manufacturers can't easily substitute) but increasingly threatened by "silver thrifting"—research to reduce silver content per panel through thinner silver pastes and alternative materials. If successful, silver per panel could decline 20-30% by 2030, partially offsetting capacity growth.
Medical and Industrial Applications
Silver's antibacterial properties create niche but growing demand in medicine (wound care, catheters) and water purification. Additionally, 5G infrastructure, Internet of Things (IoT) devices, and advanced manufacturing processes (brazing, soldering) provide incremental demand growth.
Industrial Demand Cyclicality
Unlike investment demand (counter-cyclical to stock markets), industrial demand is pro-cyclical to economic growth. Recessions reduce electronics production, construction (solar installations), and automotive output, depressing industrial silver demand. Conversely, economic booms accelerate manufacturing and industrial consumption.
How Dual Demand Creates Unique Price Dynamics
Conflicting Demand Drivers
Silver's dual nature creates paradoxes:
- Recession Scenario: Industrial demand collapses (bad for silver), but investment demand surges as investors flee stocks and seek safe havens (good for silver). Which dominates? Depends on severity. Mild recession favors industrial weakness; severe crisis/currency concerns favor investment surge.
- Economic Boom + Tight Money: Industrial demand roars as manufacturing expands (good), but rising interest rates and strong stock markets drain investment demand (bad). 2017-2019 exhibited this: robust economy but silver stagnant as investment fled to higher-yielding assets.
- "Goldilocks" Scenario: Moderate growth with inflation concerns is ideal—industrial demand healthy while investment demand supported by inflation hedging. This was 2020-2021 when silver surged toward $30/oz.
Volatility Amplification
Silver's dual demand, smaller market size, and high gold correlation create extreme volatility. Annual price swings of 30-50% are common; 2011 saw silver spike from $18 to $49 (+170%) before crashing to $26 (-47%) in months. For comparison, gold's volatility is typically 15-25% annually—half of silver's.
This volatility attracts traders and speculators but challenges long-term investors requiring stability.
Supply Response Dynamics
Because 70% of silver is mined as byproduct, supply doesn't respond efficiently to silver prices. If silver doubles from $20 to $40/oz, primary silver miners increase production modestly, but copper/zinc/lead miners producing byproduct silver don't significantly change operations (they're optimizing for primary metal, not silver). This inelastic supply amplifies price moves when demand shifts—small demand increases create larger price spikes than would occur with responsive supply.
Why This Matters for Investment Strategy
Silver as Investment Asset: Strengths
- Higher Beta to Gold: Silver's 2-3x leverage to gold price moves offers asymmetric upside during precious metals bull markets. If you're bullish on gold, silver amplifies gains.
- Inflation and Currency Hedge: Like gold, silver provides protection against currency debasement and purchasing power loss. Historically, silver has maintained value over centuries.
- Industrial Demand Floor: Unlike gold (98% monetary/jewelry), silver's industrial demand provides fundamental value floor. Even if investment demand collapses, ~500M oz of industrial consumption supports prices.
- Accessibility: Lower per-ounce price ($20-30/oz vs. $2,000+/oz for gold) makes silver accessible to smaller investors. $1,000 buys 30-50 oz silver but only 0.4-0.5 oz gold.
Silver as Investment Asset: Weaknesses
- Extreme Volatility: 30-50% annual price swings make silver unsuitable for conservative portfolios or short time horizons. Drawdowns of 50%+ are common in bear markets.
- Storage Burden: Silver's lower value per weight creates storage challenges. $10,000 in gold is ~150 grams (fits in palm); $10,000 in silver is ~15 kg (30+ pounds). Vault fees are higher per dollar value.
- Wide Bid-Ask Spreads: Physical silver premiums over spot are higher than gold (8-15% for coins vs. 3-5% for gold coins). Round-trip transaction costs easily exceed 15-20%.
- Industrial Demand Risk: Recessions or technological substitution (reduced silver content in solar panels, copper replacing silver in some electronics) can undermine demand floor.
Industrial Demand Implications for Investors
The industrial component affects investment thesis:
- Bullish Case: Electrification and solar megatrends create structural demand growth. If solar alone grows to 250M oz by 2030 and EV silver demand doubles, industrial consumption could reach 650-700M oz—approaching or exceeding current total supply. Combined with any investment demand recovery, prices could rally significantly (bull targets: $35-50/oz by late 2020s).
- Bearish Case: Silver thrifting reduces solar content by 30%, electronics miniaturization continues reducing per-device silver, and recycling increases as prices rise. Industrial demand plateaus or declines. Without strong investment demand (likely if rates stay high and stocks perform), silver stagnates or declines (bear scenario: $15-20/oz through 2020s).
- Moderate Case: Industrial demand grows modestly (2-3% annually) offsetting some byproduct supply increases. Investment demand remains choppy, creating volatile trading range of $20-32/oz with occasional spikes to $35-40 during inflation scares.
Practical Investment Approaches to Silver
Physical Silver (Coins, Bars)
- Pros: True ownership, no counterparty risk, crisis insurance, tangible asset
- Cons: High premiums (8-15%), storage burden due to weight, wide bid-ask spreads, security concerns
- Best For: Long-term holders (5+ years) willing to accept transaction costs for direct ownership
Silver ETFs (SLV, SIVR, PSLV)
- Pros: Instant liquidity, low transaction costs, no storage burden, tradable in retirement accounts
- Cons: Counterparty risk, expense ratios (0.50% for SLV), no physical redemption for retail investors
- Best For: Tactical trading, shorter time horizons, investors prioritizing liquidity over ownership
Silver Mining Stocks
- Pros: Operational leverage (miners' profits amplify silver price moves 3-5x), dividends (some), active management
- Cons: Company-specific risk, operational challenges, management quality variance, equity market correlation
- Examples: Wheaton Precious Metals (streaming company), Pan American Silver, First Majestic Silver (primary silver producers)
- Best For: Aggressive investors seeking leveraged exposure, willing to accept equity volatility
Silver Futures and Options
- Pros: Maximum leverage, precise timing, hedging capabilities
- Cons: Extreme risk, margin calls, contango costs, requires expertise
- Best For: Experienced traders only; not suitable for most investors
Allocation Frameworks
Conservative Precious Metals Allocation
- 8-10% total precious metals
- 7-8% gold (physical or ETF)
- 1-2% silver (physical coins or ETF)
- Rationale: Small silver allocation provides upside exposure with limited volatility impact
Balanced Precious Metals Allocation
- 10-15% total precious metals
- 7-10% gold
- 3-5% silver (mix of physical and ETF)
- Rationale: Meaningful silver exposure capitalizes on industrial growth and gold leverage
Aggressive Precious Metals / Industrial Demand Thesis
- 15-20% total precious metals + miners
- 5-7% gold
- 5-8% silver (ETF + physical)
- 3-5% silver miners
- Rationale: Overweight silver based on electrification/solar megatrends; accept volatility for growth potential
Key Takeaways
- Silver is uniquely split ~50% industrial demand (electronics, solar, medical) and ~30% investment demand (coins, bars, ETFs) plus ~20% jewelry
- Dual demand creates conflicting drivers: recessions hurt industrial demand but boost investment demand; booms have opposite effect
- Silver exhibits 2-3x higher volatility than gold due to smaller market size, dual demand, and speculative flows (30-50% annual swings common)
- Industrial demand provides fundamental floor unlike pure monetary metals, but also creates recession vulnerability
- Solar photovoltaic demand is fastest-growing segment, potentially reaching 200-250M oz by 2030 vs. 130M oz currently—major structural driver
- Investment demand is highly cyclical to inflation fears, currency debasement concerns, and gold price correlation
- 70% of silver is mined as byproduct making supply inelastic to silver prices, amplifying price volatility when demand shifts
- Gold-silver ratio (currently ~75-85:1) vs. historical ~60:1 suggests silver potentially undervalued relative to gold
- Physical silver has high transaction costs (15-20% round-trip) and storage burden; ETFs offer better liquidity but counterparty risk
- Optimal allocation typically small (1-5% of portfolio) due to extreme volatility; serves as high-beta complement to gold rather than core holding
Related Topics on SpotMarketCap
Conclusion
Silver's dual nature as both industrial commodity and monetary metal creates a uniquely complex and volatile market unlike any other major asset. This bifurcated demand—half from electronics, solar panels, and manufacturing, half from investors seeking inflation hedges and monetary alternatives—generates price dynamics that defy simple categorization. Silver isn't quite a pure precious metal like gold, nor is it a pure industrial metal like copper—it occupies a fascinating middle ground that creates both opportunities and challenges.
The investment case for silver in 2025 rests on powerful structural tailwinds from electrification and renewable energy. Solar panel manufacturing alone could consume 200+ million ounces annually by decade's end, while electric vehicles, 5G infrastructure, and advanced electronics provide incremental growth. If these industrial megatrends play out while investment demand recovers from 2022-2024 weakness (driven by inflation persistence or currency concerns), silver could meaningfully outperform over the 2025-2030 period.
Yet silver's volatility cannot be ignored. Annual price swings of 30-50% and drawdowns exceeding 50% during bear markets make silver unsuitable for conservative portfolios or investors with short time horizons. The conflicting pulls of industrial cyclicality and investment sentiment create whipsaws that challenge even experienced traders. Additionally, technological substitution risks—solar panel silver thrifting, alternative conductive materials—could undermine the industrial demand thesis over time.
For most investors, silver works best as a small, high-conviction allocation (1-5% of portfolio) complementing gold rather than replacing it. Silver provides leveraged exposure to precious metals during bull markets while industrial demand offers differentiation from pure monetary metals. The specific allocation depends on volatility tolerance, conviction in electrification megatrends, and whether you're willing to endure 30-50% drawdowns for potential outsized gains.
Remember: Silver's dual demand is both blessing and curse—industrial applications provide fundamental demand floor and growth potential, but also create volatility and recession vulnerability absent from pure monetary metals. Understanding which demand driver dominates in different market regimes is key to successfully investing in this uniquely positioned metal.
Track Real-Time Asset Prices
Get instant access to live cryptocurrency, stock, ETF, and commodity prices. All assets in one powerful dashboard.
Related Articles
Should I Invest in Silver or Gold? Complete Comparison Guide
Silver vs. gold investment decision: Compare volatility, returns, storage, and allocation strategies. Discover the optimal gold-silver ratio for your portfolio in 2025.
How Much to Invest in Silver? Complete Investment Guide
Determine your optimal silver allocation (2-15% range). Learn starter positions, scaling strategies, gold-silver ratios, and how to build silver holdings for growth and protection.
Why Is Silver So Cheap Compared to Gold?
Discover why silver trades at 1/80th of gold's price. Learn about the gold-silver ratio, supply differences, industrial vs. monetary demand, and whether silver is undervalued for investors.